Let’s start with a nice project I implemented last week-end: setup temperature probes on my air conditioner and display results on an internal web server, using nice looking graphs.
Project is simple:
- hardware setup: I used 1-wire temperatures probes, that I connected myself over a long long cable. This is my “analogical network”
- analogical to numeric data converter, via a computer: I selected the wonderful owfs running on various OS (Linux Ubuntu for me). This software is giving you the possibility to query the temperature probes from the computer (and even from another computer over the data network), as simply as you would list a disk directory…
- graph rendering: I turned to a well-known solution, RRDtools, installed on my local network webserver, querying information on temperatures over my data network
- develop a little set of html/php pages to display the graphs provided by RRDtools (home made pages)
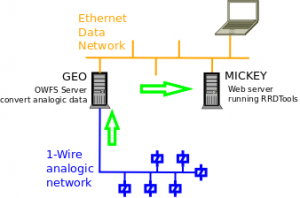
To make it short, a little drawing of the main principles of this project:
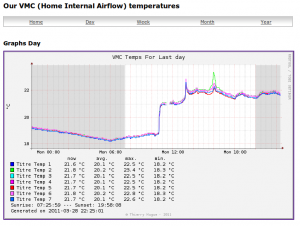
 When I connect, via my computer/laptop, on my web server, I get this kind of page:
 (yes, I built a solution with 7 temperature probes… right now, they are not in their final place, but grouped altogether in a pack, that I moved from one place to another, which explains the quick temperature variation you can see….).
It’s getting late now, it’s time to have a rest. This project description will be continued in a future article with details of each step above (next one = 1-wire network).
